Your Email Address Creating these results can take several minutes depending on server demand - please provide the email address that the results should be sent to.
Email Address Date Range Limit the time period of analysis. The earliest allowable date for event data is currently January 1, 1979 and the latest date allowed is the current day.
Start Date End Date Search Criteria - Actors Select the specific actors involved in the event. The CAMEO taxonomy used by GDELT codifies an "event" as an action performed by one entity (Actor1) onto another (Actor2). GDELT codifies an array of 58 fields of information about each event. Using the form below you can restrict your search to just those events initiated by a specific country and/or type against another country and/or type. For example, to select all attacks on civilians in Nigeria, you would specify "Civilians" using the "Actor2 Type" dropdown below, "Nigeria" using the "Event Location" dropdown below, and then violence-related event types using the next section. To select all protests in Nigeria, you would leave the Actor section below blank, and select protest-related event types from the following section and "Nigeria" as the "Event Location."
Initiator (Actor1) Country: Afghanistan Africa Aland Islands Albania Algeria American Samoa Andorra Angola Anguilla Antigua and Barbuda Argentina Armenia Aruba Asia Australia Austria Azerbaijan Baghdad Bahamas Bahrain Balkans Bangladesh Barbados Belarus Belgium Belize Benin Bermuda Bhutan Bolivia Bosnia and Herzegovina Botswana Brazil British Virgin Islands Brunei Darussalam Bulgaria Burkina Faso Burundi Cambodia Cameroon Canada Cape Verde Caribbean Caucasus Cayman Islands Central Africa Central African Republic Central Asia Central Europe Chad Chile China Columbia Comoros Cook Islands Costa Rica Croatia Cuba Cyprus Czech Republic Democratic Republic of the Congo Denmark Djibouti Dominica Dominican Republic East Indies East Timor Eastern Africa Eastern Europe Ecuador Egypt El Salvador Equatorial Guinea Eritrea Estonia Ethiopia Europe Faeroe Islands Falkland Islands Fiji Finland France French Guiana French Polynesia Gabon Gambia Gaza Strip Georgia Germany Ghana Gibraltar Greece Greenland Grenada Guadeloupe Guam Guatemala Guinea Guinea-Bissau Guyana Haiti Honduras Hong Kong Hungary Iceland India Indonesia Iran Iraq Ireland Isle of Man Israel Italy Ivory Coast Jamaica Japan Jordan Kazakhstan Kenya Kiribati Kuwait Kyrgyzstan Laos Latin America Latvia Lebanon Lesotho Liberia Libya Liechtenstein Lithuania Luxembourg Macao Macedonia Madagascar Malawi Malaysia Maldives Mali Malta Marshall Islands Martinique Mauritania Mauritius Mayotte Mediterranean Mexico Micronesia Middle East Moldova Monaco Mongolia Montenegro Montserrat Morocco Mozambique Myanmar Namibia Nauru Nepal Netherlands Netherlands Antilles New Caledonia New Zealand Nicaragua Niger Nigeria Niue Norfolk Island North Africa North America North Korea Northern Mariana Islands Norway Occupied Palestinian Territory Oman Pakistan Palau Panama Papua New Guinea Paraguay People's Republic of the Congo Persian Gulf Peru Philippines Pitcairn Poland Portugal Puerto Rico Qatar Romania Runion Russia Rwanda Saint Helena Saint Kitts-Nevis Saint Lucia Saint Pierre and Miquelon Saint Vincent and the Grenadines Samoa San Marino Sao Tome and Principe Saudi Arabia Scandinavia Senegal Serbia Seychelles Sierra Leone Singapore Slovakia Slovenia Solomon Islands Somalia South Africa South America South Asia South Korea Southeast Asia Southern Africa Spain Sri Lanka Sudan Suriname Svalbard and Jan Mayen Islands Swaziland Sweden Switzerland Syria Taiwan Tajikistan Tanzania Thailand The West Togo Tokelau Tonga Trinidad and Tobago Tunisia Turkey Turkmenistan Turks and Caicos Islands Tuvalu Uganda Ukraine United Arab Emirates United Kingdom United States United States Virgin Islands Uruguay Uzbekistan Vanuatu Vatican City Venezuela Vietnam Wallis and Futuna Islands West Africa West Bank Western Sahara Yemen Zambia Zimbabwe Initiator (Actor1) Type: Agriculture Amnesty International Business Civilian Criminal Development Education Elites Environmental Government Greenpeace Health Human Rights Insurgents Inter-Governmental Organization International Militarized Group International/Transnational Generic Judiciary Labor Legislature Media Military Moderate Multinational Corporation Non-Governmental Movement Non-Governmental Organization Peacekeepers Police forces Political Opposition Radical Rebels Red Cross Refugees Separatist Rebels Settler State Intelligence Unaligned Armed Forces Unidentified State Actor Unidentified State Actor United Nations Recipient/Victim (Actor2) Country: Afghanistan Africa Aland Islands Albania Algeria American Samoa Andorra Angola Anguilla Antigua and Barbuda Argentina Armenia Aruba Asia Australia Austria Azerbaijan Baghdad Bahamas Bahrain Balkans Bangladesh Barbados Belarus Belgium Belize Benin Bermuda Bhutan Bolivia Bosnia and Herzegovina Botswana Brazil British Virgin Islands Brunei Darussalam Bulgaria Burkina Faso Burundi Cambodia Cameroon Canada Cape Verde Caribbean Caucasus Cayman Islands Central Africa Central African Republic Central Asia Central Europe Chad Chile China Columbia Comoros Cook Islands Costa Rica Croatia Cuba Cyprus Czech Republic Democratic Republic of the Congo Denmark Djibouti Dominica Dominican Republic East Indies East Timor Eastern Africa Eastern Europe Ecuador Egypt El Salvador Equatorial Guinea Eritrea Estonia Ethiopia Europe Faeroe Islands Falkland Islands Fiji Finland France French Guiana French Polynesia Gabon Gambia Gaza Strip Georgia Germany Ghana Gibraltar Greece Greenland Grenada Guadeloupe Guam Guatemala Guinea Guinea-Bissau Guyana Haiti Honduras Hong Kong Hungary Iceland India Indonesia Iran Iraq Ireland Isle of Man Israel Italy Ivory Coast Jamaica Japan Jordan Kazakhstan Kenya Kiribati Kuwait Kyrgyzstan Laos Latin America Latvia Lebanon Lesotho Liberia Libya Liechtenstein Lithuania Luxembourg Macao Macedonia Madagascar Malawi Malaysia Maldives Mali Malta Marshall Islands Martinique Mauritania Mauritius Mayotte Mediterranean Mexico Micronesia Middle East Moldova Monaco Mongolia Montenegro Montserrat Morocco Mozambique Myanmar Namibia Nauru Nepal Netherlands Netherlands Antilles New Caledonia New Zealand Nicaragua Niger Nigeria Niue Norfolk Island North Africa North America North Korea Northern Mariana Islands Norway Occupied Palestinian Territory Oman Pakistan Palau Panama Papua New Guinea Paraguay People's Republic of the Congo Persian Gulf Peru Philippines Pitcairn Poland Portugal Puerto Rico Qatar Romania Runion Russia Rwanda Saint Helena Saint Kitts-Nevis Saint Lucia Saint Pierre and Miquelon Saint Vincent and the Grenadines Samoa San Marino Sao Tome and Principe Saudi Arabia Scandinavia Senegal Serbia Seychelles Sierra Leone Singapore Slovakia Slovenia Solomon Islands Somalia South Africa South America South Asia South Korea Southeast Asia Southern Africa Spain Sri Lanka Sudan Suriname Svalbard and Jan Mayen Islands Swaziland Sweden Switzerland Syria Taiwan Tajikistan Tanzania Thailand The West Togo Tokelau Tonga Trinidad and Tobago Tunisia Turkey Turkmenistan Turks and Caicos Islands Tuvalu Uganda Ukraine United Arab Emirates United Kingdom United States United States Virgin Islands Uruguay Uzbekistan Vanuatu Vatican City Venezuela Vietnam Wallis and Futuna Islands West Africa West Bank Western Sahara Yemen Zambia Zimbabwe Recipient/Victim (Actor2) Type: Agriculture Amnesty International Business Civilian Criminal Development Education Elites Environmental Government Greenpeace Health Human Rights Insurgents Inter-Governmental Organization International Militarized Group International/Transnational Generic Judiciary Labor Legislature Media Military Moderate Multinational Corporation Non-Governmental Movement Non-Governmental Organization Peacekeepers Police forces Political Opposition Radical Rebels Red Cross Refugees Separatist Rebels Settler State Intelligence Unaligned Armed Forces Unidentified State Actor Unidentified State Actor United Nations Search Criteria - Event Select the specific type and/or location of events you are interested in. The full CAMEO taxonomy defines over 300 specific categories of events, but to simplify things, the search interface below lets you search only for the 20 root categories under which those other event types fall, or you can select by "Quad Class", which groups the 20 root categories into 4 "super categories".
Event Code: Make Public Statement (01) Appeal (02) Express Intent to Cooperate (03) Consult (04) Engage in Diplomatic Cooperation (05) Engage in Material Cooperation (06) Provide Aid (07) Yield (08) Investigate (09) Demand (10) Disapprove (11) Reject (12) Threaten (13) Protest (14) Exhibit Force Posture (15) Reduce Relations (16) Coerce (17) Assault (18) Fight (19) Use Unconventional Mass Violence (20) OR
Event Quad Class: Verbal Cooperation Material Cooperation Verbal Conflict Material Conflict
Event Location: Afghanistan Akrotiri Sovereign Base Area Albania Algeria American Samoa Andorra Angola Anguilla Antarctica Antigua and Barbuda Argentina Armenia Aruba Ashmore and Cartier Islands Australia Austria Azerbaijan Bahamas, The Bahrain Baker Island Bangladesh Barbados Bassas da India Belarus Belgium Belize Benin Bermuda Bhutan Bolivia Bosnia-Herzegovina Botswana Bouvet Island Brazil British Indian Ocean Territory British Virgin Islands Brunei Bulgaria Burkina Faso Burundi Cambodia Cameroon Canada Cape Verde Cayman Islands Central African Republic Chad Chile China Christmas Island Clipperton Island Cocos (Keeling) Islands Colombia Comoros Congo Cook Islands Coral Sea Islands Costa Rica Cote d'Ivoire Croatia Cuba Cyprus Czech Republic Czechoslovakia Democratic Republic of the Congo Denmark Dhekelia Sovereign Base Area Djibouti Dominica Dominican Republic East Timor Ecuador Egypt El Salvador Equatorial Guinea Equatorial Guinea Eritrea Estonia Ethiopia Etorofu, Habomai, Kunashiri and Shikotan Islands Europa Island Falkland Islands (Islas Malvinas) Faroe Islands Fiji Finland France French Guiana French Polynesia French Southern and Antarctic Lands Gabon Gambia Gaza Strip Georgia Germany Germany Ghana Gibraltar Glorioso Islands Greece Greenland Grenada Guadeloupe Guam Guatemala Guernsey Guinea Guinea-Bissau Guyana Haiti Heard Island and McDonald Islands Honduras Hong Kong Howland Island Hungary Iceland India Indonesia Iran Iraq Ireland Isle of Man Israel Italy Jamaica Jan Mayen Japan Jarvis Island Jersey Johnston Atoll Jordan Juan de Nova Island Kazakhstan Kenya Kingman Reef Kiribati Kosovo Kuwait Kyrgyzstan Laos Latvia Lebanon Lesotho Liberia Libya Liechtenstein Lithuania Luxembourg Macau Macedonia Madagascar Malawi Malaysia Maldives Mali Malta Marshall Islands Martinique Mauritania Mauritius Mayotte Mexico Micronesia Midway Islands Moldova Monaco Mongolia Montenegro Montserrat Morocco Mozambique Myanmar Namibia Nauru Navassa Island Nepal Netherlands Netherlands Antilles New Caledonia New Zealand Nicaragua Niger Nigeria Niue No Man's Land Norfolk Island North Korea Northern Mariana Islands Norway Oceans Oman Pakistan Palau Palmyra Atoll Panama Papua New Guinea Paracel Islands Paraguay Peru Philippines Pitcairn Islands Poland Portugal Puerto Rico Qatar Reunion Romania Russia Rwanda Saint Helena Saint Kitts and Nevis Saint Lucia Saint Martin Saint Pierre and Miquelon Saint Vincent and the Grenadines Saint-Barthelemy Island Samoa San Marino Sao Tome and Principe Saudi Arabia Senegal Serbia Seychelles Sierra Leone Singapore Slovak Republic Slovenia Solomon Islands Somalia South Africa South Georgia and the South Sandwich Islands South Korea South Sudan Spain Spratly Islands Sri Lanka Sudan Suriname Svalbard Swaziland Sweden Switzerland Syria Taiwan Tajikistan Tanzania Thailand Togo Tokelau Tonga Trinidad and Tobago Tromelin Island Tunisia Turkey Turkmenistan Turks and Caicos Islands Tuvalu Uganda Ukraine Undersea Features Undesignated Sovereignty United Arab Emirates United Kingdom United States Uruguay Uzbekistan Vanuatu Vatican City Venezuela Vietnam, Democratic Republic of Vietnam, Republic of Virgin Islands Wake Island Wallis and Futuna West Bank Western Sahara Yemen Zambia Zimbabwe Location Weighting How should the "weight" of each location be calculated?
Cutoff Thresholds If your network ends up being too large or too small, you may decide to adjust the cutoff thresholds below. Node Cutoff sets how many events/articles a location must appear in before it is included in the graph, while Edge Cutoff sets how many events/articles must connect a pair of locations before they are connected in the network. The counts measured by these cutoffs are affected by your selection in the Edge Weighting section above.
Node Cutoff Edge Cutoff Outputs The following output files will be generated:
Google Earth .KML File This outputs a .KML file that can be opened in Google Earth that color-codes each city and connection among them from bright red (strongly conflictive) to bright green (strongly cooperative). These files are usually too large to be previewed in Google Maps, but the free edition of Google Earth (https://www.google.com/earth/) can display them easily. They can also be loaded into many GIS applications.
Geographic Gephi File This outputs a Gephi .GEXF file that color-codes each city and connection among them from bright red (strongly conflictive) to bright green (strongly cooperative). The file includes special latitude and longitude attributes on each node and the new GEXF version 1.2 edge coloring to allow network links to be colored according to Goldstein Scale. If you install Gephi's "Geo" layout algorithm you can render this in map format directly in Gephi.
Goldstein Scale Network .DOT Graphviz File Generates a .DOT file in the Graphviz file format that color-codes each city and connection among them from bright red (strongly conflictive) to bright green (strongly cooperative). This file can be directly imported into GraphViz's "neato" utility for rendering or into any package that supports the .DOT format for further analysis.
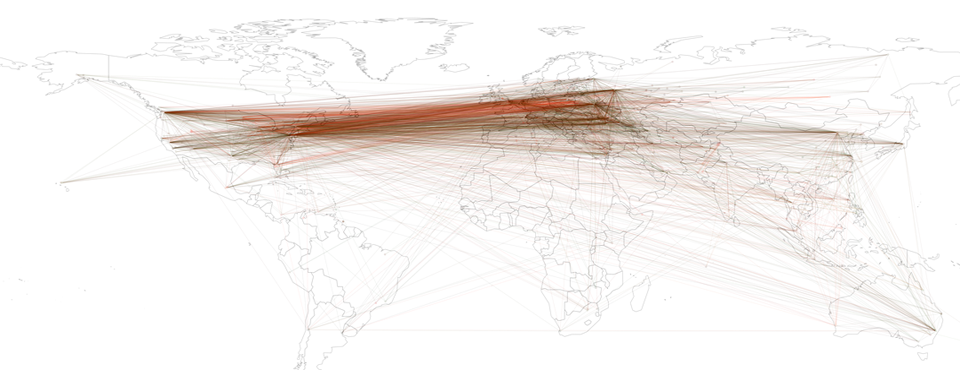
Goldstein Scale Network Preview Image Generates a .PNG preview image of the Goldstein Scale Network, rendered using GraphViz. Nodes and edges are made semi-transparent so that only the strongest connections are visible.
Intensity Network .DOT Graphviz File Generates a .DOT file in the Graphviz file format that records each city and connection among them. Nodes and edges are NOT color-coded, they are designed to render out as white lines that can be overlaid onto a dark map. This map makes macro-level spatial patterns easiesr to spot than the Goldstein Scale map above. This file can be directly imported into GraphViz's "neato" utility for rendering or into any package that supports the .DOT format for further analysis.
Intensity Network Preview Image Generates a .PNG preview image of the Intensity Network, rendered using GraphViz. Nodes and edges are made semi-transparent so that only the strongest connections are visible. Black background makes it easier to spot macro-level patterns.
Submit